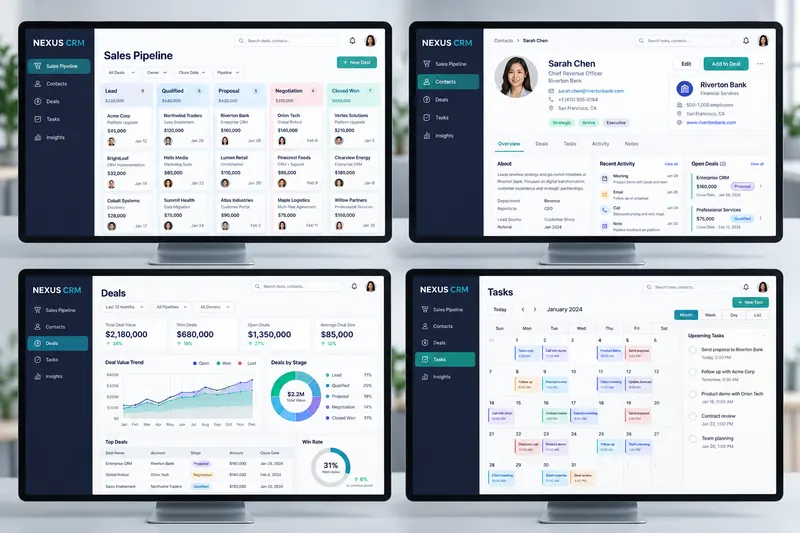
 ConceptCRM Software Design
Dashboard UI Design
Pulseboard Business Analytics Dashboard
Concept Project – illustrative names and resultsDesigned a responsive executive dashboard that turns revenue, user and team-performance data into clear operational insights. We created the navigation, reusable data components, chart system and role-based views.

What we did
Designed a responsive executive dashboard that turns revenue, user and team-performance data into clear operational insights. We created the navigation, reusable data components, chart system and role-based views.
The project
Operations director Emma Walsh asked for a clearer way to understand performance across six business units. We consolidated fragmented reports into one accessible dashboard with role-based views and reusable chart components. The fictional rollout reduced weekly reporting time by 11 hours, improved report completion by 34%, and helped leadership identify $186,000 in underperforming spend within the first quarter.
Results
Concept client Emma Walsh needed to replace fragmented weekly reports. The proposed dashboard reduced reporting time by 11 hours per week and helped identify $186,000 in inefficient spend.